India’s reservoirs stand at 63.3% of capacity, but the national figure masks the sharper storage stress in the South. The article explains why this regional gap matters for irrigation and drinking-water supply.
UPSC relevance:
|
Prelims GS Paper I |
Indian Geography and Environment |
Southwest monsoon, rainfall deficits, types of drought, reservoir live storage and rabi crops |
|
Mains GS Paper I |
Physical Geography |
Regional rainfall variability, catchment runoff and uneven reservoir replenishment |
|
Mains GS Paper III |
Agriculture and Irrigation |
Impact of low reservoir storage on rabi irrigation, crop choices and micro-irrigation |
|
Mains GS Paper III |
Disaster Management and Water Conservation |
Drought monitoring and mitigation, reservoir release planning and groundwater recharge |
Rainfall Deficits Before and After the Monsoon
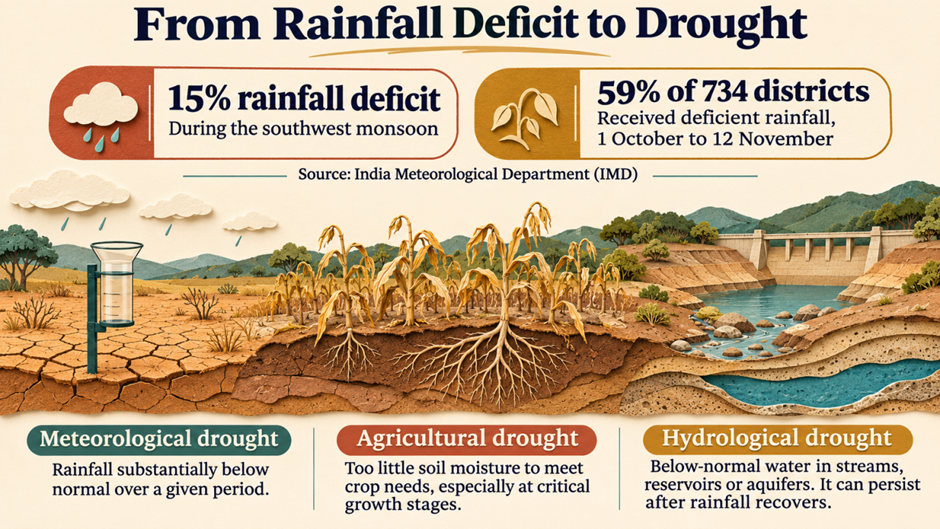
According to the India Meteorological Department (IMD), 59% of India’s 734 districts received deficient rainfall between 1 October and 12 November. This followed a 15% rainfall deficit during the southwest monsoon, which left nearly half the country facing drought-like conditions.
|
Type of drought |
What to look for |
|
Meteorological drought |
Rainfall substantially below normal over a given period. |
|
Agricultural drought |
Soil moisture insufficient to meet crop needs, especially at critical growth stages. |
|
Hydrological drought |
Below-normal water availability in streams, reservoirs or aquifers. It can persist after rainfall recovers. |
National Storage Falls by 49.2 BCM
Water storage in India’s 178 monitored reservoirs declined further during the week, reaching 116.9 billion cubic metres (BCM). This was 63.3% of their combined live storage capacity of 184.8 BCM.
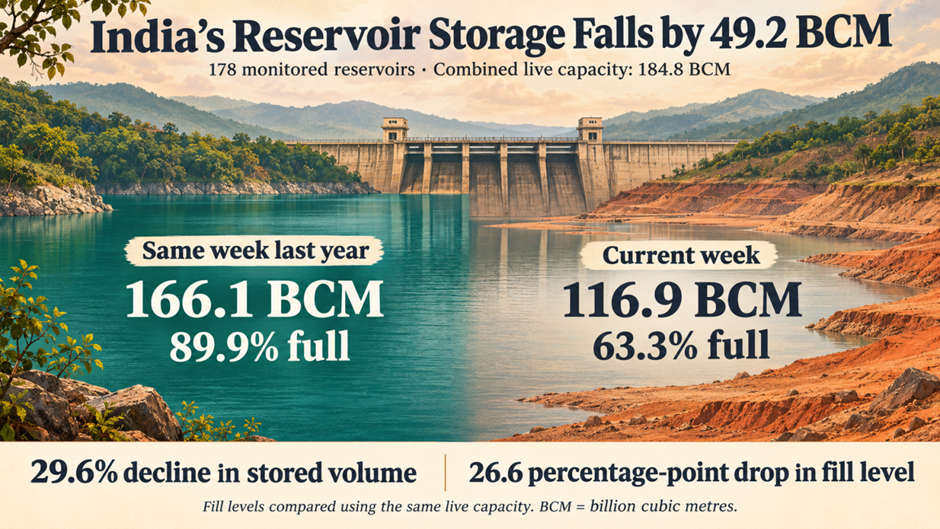
In the corresponding week a year earlier, these reservoirs held 166.1 BCM. The difference of 49.2 BCM represents a 29.6% year-on-year decline in the volume of water stored. The source also reports storage at 20 percentage points below the 10-year average.
*For exam use, the roughly 30% year-on-year decline refers to stored volume. Using the stated capacity of 184.8 BCM as a common denominator, the fill level fell from about 89.9% to 63.3%, a decline of 26.6 percentage points.*
Central India Leads, Southern India Lags
Reservoir storage declined across all five regions during the week. Each region also held less water than in the corresponding period last year. Even so, the central and eastern regions were at or above 75% of live capacity, and the western region remained above 70%.
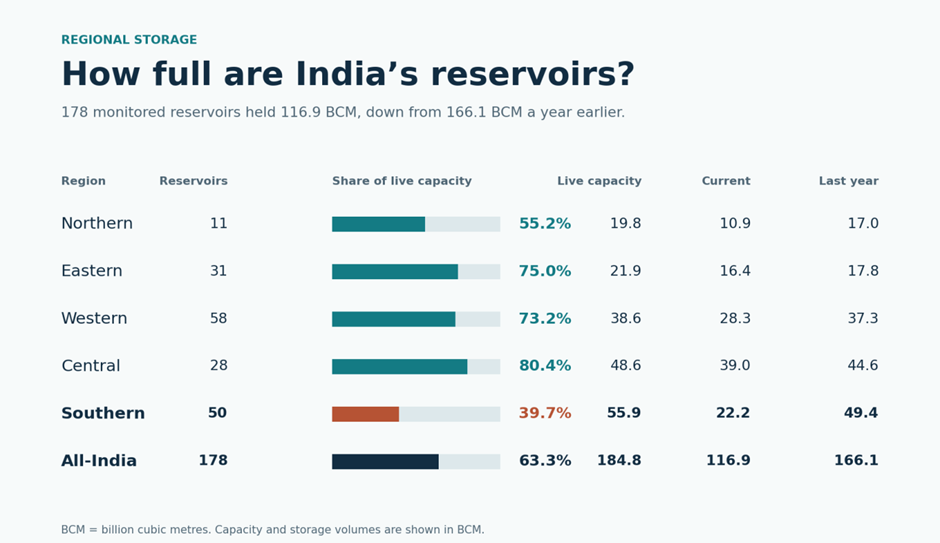
The central region had the highest fill level at 80.4%, followed by the eastern region at 75.0% and the western region at 73.2%. The northern region stood at 55.2%.
The southern region had the largest combined live storage capacity (55.9 BCM) and the lowest fill level (39.7%). After improving the previous week, its storage fell to 22.2 BCM. A year earlier, it held 49.4 BCM. The South’s year-on-year decline of 27.2 BCM accounted for about 55% of the national decline.
Cyclones Brought Uneven Relief
Two cyclones hit the southern region within a month, yet reservoir levels there showed little improvement. Storage remained a concern in Tamil Nadu, Andhra Pradesh, Karnataka and Telangana. In Odisha, cyclone-induced rainfall raised reservoir storage to 81.6% of capacity.
Reservoirs fill when rainfall produces runoff in their upstream catchments. The amount of water stored depends on where and when rain falls, how much the soil absorbs, how much water flows into the reservoir, and how much is released or lost through evaporation. A cyclone can therefore bring heavy rain to a region while adding little water to some reservoirs if the rain falls outside their main catchments. The contrast between Odisha and southern India illustrates why catchment-level rainfall and inflows matter for assessing reservoir recovery.
One in Three Reservoirs Was Half Full or Less
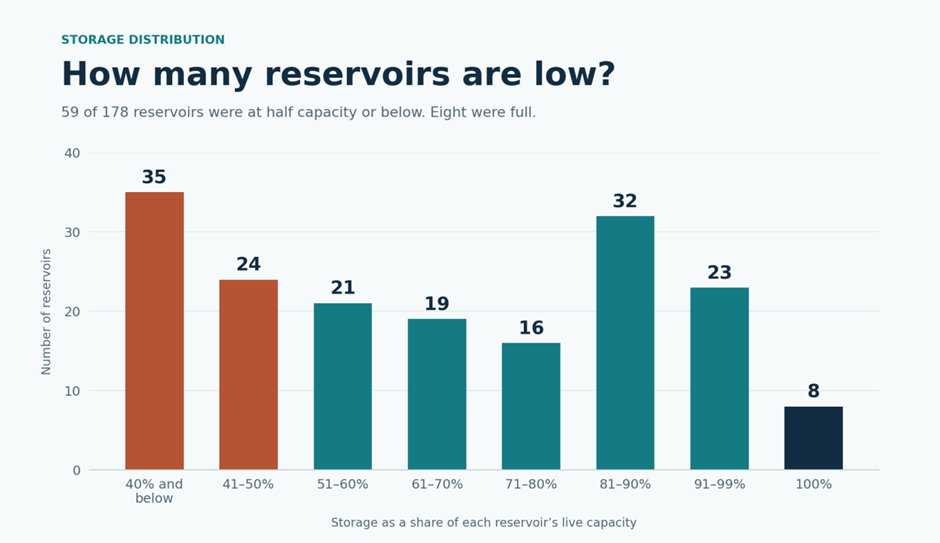
The largest single group consisted of 35 reservoirs at 40% capacity or below. Overall, 59 of the 178 reservoirs, roughly one in three, were at half capacity or below.
At the other end of the distribution, 31 reservoirs were at 91% capacity or higher, including eight at full capacity. Jharkhand accounted for four of those eight full reservoirs.
Low post-monsoon storage can constrain canal releases for rabi irrigation, particularly in areas dependent on reservoirs. Farmers with access to wells may compensate by pumping more groundwater. Reservoir operators may also have to balance drinking-water supply, irrigation and hydropower generation as the dry season approaches. The impact varies with local crop choices, groundwater availability and the timing of water releases.
Why the National Figure Can Mask Regional Stress
Live storage capacity is the volume of water a reservoir can hold for operational use above its minimum drawdown level. The national fill level of 63.3% compares the total volume stored with the combined live storage capacity of the monitored reservoirs. The storage distribution chart answers a separate question by counting how many individual reservoirs fall into each fill band.
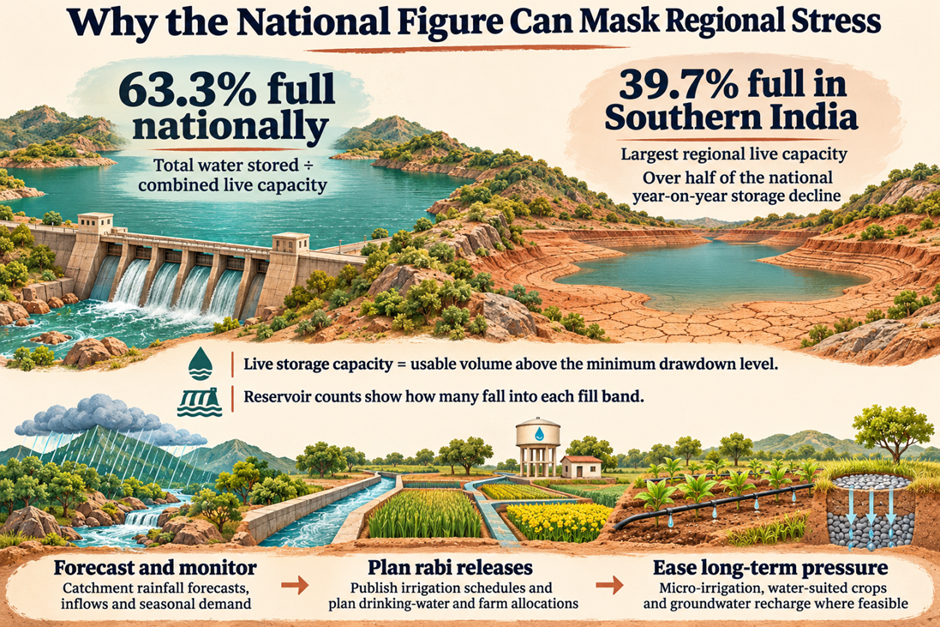
Both measures matter for assessing water availability. The national figure shows the overall volume position, while the regional breakdown and reservoir counts reveal where storage is low. Southern India illustrates this clearly. It had the largest regional live capacity, yet it was only 39.7% full and accounted for more than half of the national year-on-year storage decline.
Reservoir management should combine catchment-level rainfall forecasts, inflow monitoring and seasonal demand estimates. Before the rabi season, authorities can publish irrigation release schedules and plan allocations for drinking water and agriculture. Over the longer term, micro-irrigation, crops suited to local water availability, and groundwater recharge where feasible can reduce pressure on reservoir storage.