Keeling Curve & Rising CO₂ Levels
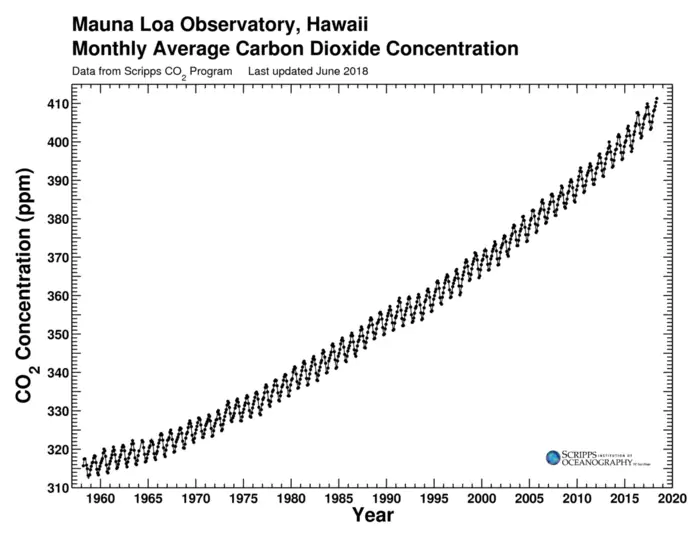
The Keeling Curve is a fundamental dataset in climate science, providing empirical evidence of the steady increase in atmospheric carbon dioxide (CO₂) levels due to human activities.
Definition:
The Keeling Curve is a
graph showing the continuous rise in atmospheric CO₂ levels, based on
measurements taken at Mauna Loa Observatory, Hawaii, since 1958 by
Dr. Charles David Keeling.
Significance:
- The Keeling Curve provides direct proof of human-induced climate change.
- It is one of the longest-running datasets in climate science.
- It shows both long-term increases and short-term seasonal variations in CO₂ levels.
Key Observations:
- 1958 CO₂ Levels: ~315 ppm (parts per million)
- 2023 CO₂ Levels: ~422 ppm
- Rate of Increase: ~2.5 ppm per year (faster than any natural increase in the past 3 million years)
- Thresholds of Concern: 450+ ppm could lead to dangerous global warming (>2°C above pre-industrial levels)
History & Background of the Keeling Curve
Who was Charles David Keeling?
- A climate scientist from Scripps Institution of Oceanography.
- Began measuring atmospheric CO₂ levels in 1958 at Mauna Loa Observatory, Hawaii.
- Discovered the continuous rise of CO₂ levels, contradicting the belief that the oceans absorbed all excess CO₂.
- His work laid the foundation for climate change science and won global recognition.
Why Mauna Loa?
Mauna Loa was chosen because:
- Far from urban pollution, ensuring clean atmospheric readings.
- High altitude (~3,400m), allowing measurement of well-mixed air.
- Minimal local vegetation impact, preventing biased CO₂ fluctuations.
What Does the Keeling Curve Show?
Two Major Features of the Keeling Curve:
Steady
Upward Trend (Long-Term)
- Represents the increase in global atmospheric CO₂ due to human activities (fossil fuel burning, deforestation).
- CO₂ levels have risen by more than 140 ppm since pre-industrial times (~280 ppm to ~422 ppm).
Annual Seasonal Variations (Short-Term)
- Caused by the seasonal uptake and release of CO₂ by plants.
- In spring/summer, plants absorb CO₂ → Levels decrease.
- In fall/winter, plants decay, releasing CO₂ → Levels increase.
Long-Term Trends: The “Hockey Stick” Curve
- Before 1750: CO₂ remained stable (~280 ppm) for over 800,000 years.
- Post-Industrial Revolution: CO₂ started rising due to fossil fuel combustion.
- Today: Fastest CO₂ rise in Earth’s history.
Historical CO₂ Data from Ice Cores:
- Antarctic Ice Core Data shows that CO₂ never exceeded 300 ppm in the past 800,000 years.
- Modern CO₂ levels (~422 ppm) are unprecedented in at least 3 million years.
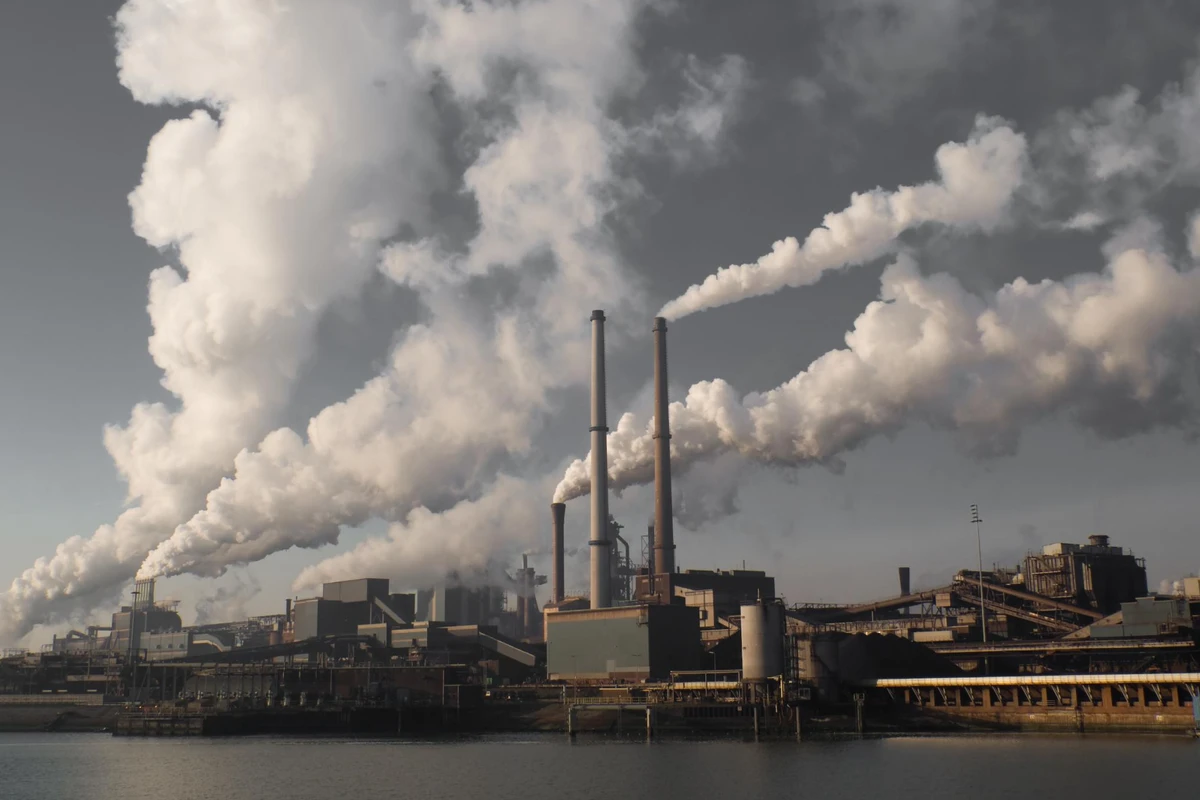
Causes of Rising CO₂ Levels
Primary Human Activities Increasing CO₂
- Fossil Fuel Combustion (~75%)
- Coal, oil, gas burning releases stored carbon as CO₂.
- Major contributors: Transportation, electricity generation, industry.
- Deforestation (~15%)
- Trees absorb CO₂ via photosynthesis; cutting forests reduces CO₂ uptake.
- Slash-and-burn agriculture directly releases stored CO₂.
- Industrial & Agricultural Processes (~10%)
- Cement production releases CO₂ from limestone.
- Livestock farming increases methane (CH₄), a potent greenhouse gas.
Top CO₂-Emitting Countries (2023 Data)
| Country | CO₂ Emissions (Million Metric Tons) | % of Global Emissions |
|---|---|---|
| China | 11,472 | 30% |
| USA | 5,011 | 14% |
| India | 2,942 | 7% |
| EU | 2,774 | 7% |
| Rest of World | 10,500 | 42% |
Key CO₂ Milestones:
| Year | CO₂ Level (ppm) | Change Since 1750 |
|---|---|---|
| 1750 (Pre-Industrial) | 280 ppm | Baseline |
| 1958 (Start of Keeling Curve) | 315 ppm | +35 ppm |
| 2000 | 370 ppm | +90 ppm |
| 2013 | 400 ppm | +120 ppm |
| 2023 | ~422 ppm | +142 ppm |
| 2050 (Projected) | 450+ ppm | Critical Threshold for 2°C Warming |
Impact of Exceeding 450 ppm:
- Risk of crossing climate tipping points
- Melting glaciers & sea-level rise
- More heatwaves, droughts, and extreme weather events
Impacts of Rising CO₂ Levels
How Does CO₂ Cause Global Warming?
- CO₂ traps infrared radiation (heat) in the atmosphere, preventing it from escaping into space.
- More CO₂ = More heat trapped, leading to climate change.
Consequences of High CO₂ Levels
- Global Warming: +1.2°C since 1880, heading toward +1.5–2°C.
- Sea Level Rise: Thermal expansion + ice sheet melting (Greenland, Antarctica).
- Extreme Weather: More heatwaves, hurricanes, floods, wildfires.
- Ocean Acidification: CO₂ absorption lowers pH, harming marine life.
- Agricultural Disruptions: Crop yields affected by extreme climate shifts.
Climate Thresholds & Tipping Points
- 450 ppm – Danger zone: Risk of irreversible climate damage.
- 500+ ppm – Could lead to runaway global warming & ecosystem collapse.
The Role of Climate Policies & Global Agreements
Key International Climate Actions
- Paris Agreement (2015) → Limit global warming to <2°C, preferably 1.5°C.
- Net-Zero Goals → USA, EU (by 2050), China, India (by 2060).
- Carbon Pricing & Emission Trading Systems (ETS).
- Renewable Energy Transition (solar, wind, nuclear).
Possible Solutions for Reducing CO₂
- Decarbonizing Energy – Shift from coal to renewables.
- Reforestation & Carbon Sequestration – Increase CO₂ absorption.
- Carbon Capture & Storage (CCS) – Store CO₂ underground.
- Stronger Climate Policies – Stricter emission regulations.
The Keeling Curve is the most critical dataset in climate science, proving the undeniable rise in atmospheric CO₂ due to human activities. Unless CO₂ emissions are reduced, we risk crossing climate tipping points, leading to irreversible damage.
What Must Be Done?
- Rapid transition to clean energy sources.
- Increased global cooperation in climate policies.
- Strengthened carbon removal & offset mechanisms.
Final Thought:
“The Keeling Curve doesn’t lie—CO₂ levels are rising, and so are the risks.”