Impact of El Niño on Indian Monsoon
The Indian monsoon, driven by complex ocean-atmosphere interactions, is highly sensitive to global climatic phenomena, particularly El Niño. El Niño is the warm phase of the El Niño-Southern Oscillation (ENSO) cycle, which originates in the equatorial Pacific Ocean but profoundly influences Indian monsoon rainfall patterns through teleconnections (long-range climate interactions).
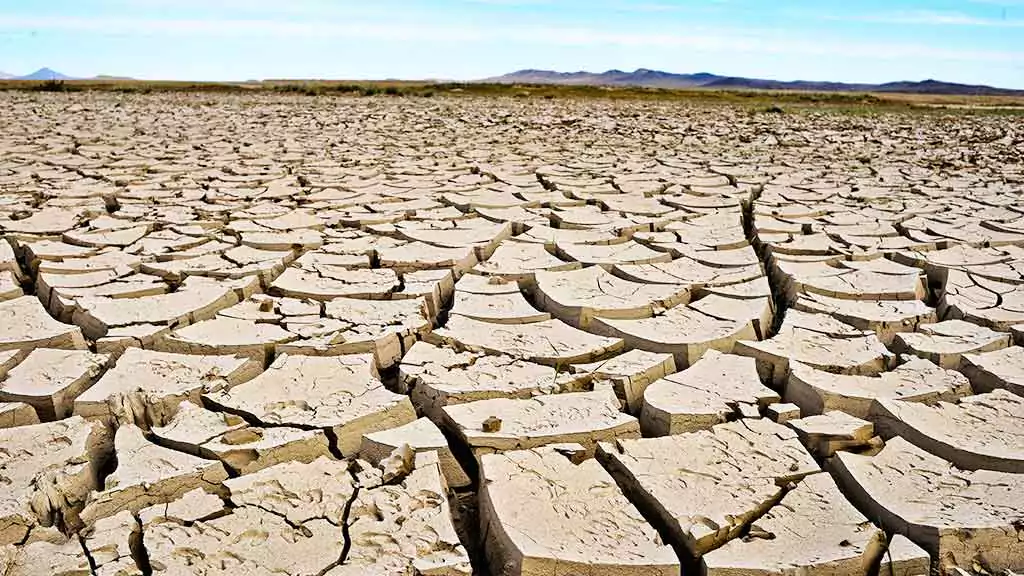
In most El Niño years, India experiences deficient monsoonal rainfall, increased drought frequency, and altered weather patterns, impacting agriculture, water availability, and the economy. However, the strength and impact of El Niño vary depending on other climate drivers, such as the Indian Ocean Dipole (IOD) and Madden-Julian Oscillation (MJO).
What is El Niño?
Definition and Mechanism
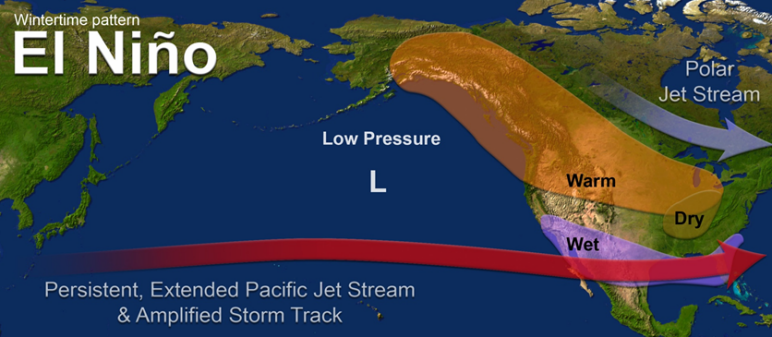
El Niño is a climatic phenomenon due to anomalous warming of sea surface temperatures (SSTs) in the central and eastern equatorial Pacific Ocean. This warming disrupts global atmospheric and oceanic circulation patterns, leading to significant changes in weather across various regions, including weaker monsoons in India and droughts in Australia and Indonesia, while causing excess rainfall in South America.
For an event to be classified as El Niño, the SST anomaly must be ≥0.5°C above normal in the Nino 3.4 region (5°N-5°S, 120°W-170°W) for at least three consecutive months.
How Does El Niño Form?
The development of El Niño is primarily driven by complex air-sea interactions, beginning with:
- Weakening of the Trade Winds
- Normally, strong easterly trade winds blow from the South American coast (high pressure) to the western Pacific (low pressure), pushing warm waters westward.
- During El Niño, these trade winds weaken or even reverse direction.
- Accumulation of Warm Water in the Central and Eastern Pacific
- As trade winds weaken, warm surface water that typically remains in the western Pacific (near Indonesia and Australia) spreads eastward toward South America.
- This leads to a positive Sea Surface Temperature Anomaly (SSTA), where SSTs in the central and eastern Pacific increase above normal.
- Disruption of Atmospheric Convection Patterns
- In normal years, strong convection (rising warm air and cloud formation) occurs over the western Pacific and Indian Ocean, fueling the Indian monsoon.
- During El Niño, convection shifts to the central and eastern Pacific, reducing cloud formation and rainfall over India.
Key Characteristics of El Niño
| Feature | Effect |
|---|---|
| Sea Surface Temperature Anomaly (SSTA) | Warming of central and eastern Pacific Ocean |
| Trade Winds | Weakened or reversed easterly winds |
| Walker Circulation | Weakened or reversed (leading to weaker monsoon) |
| Indian Ocean Conditions | Cooler SSTs, suppressed convection, drier climate |
| South America (Peru, Ecuador) | Excess rainfall, flooding |
| India & Southeast Asia | Weak monsoon, drought risk |
ENSO (El Niño-Southern Oscillation) Cycle
The El Niño-Southern Oscillation (ENSO) is a periodic climate pattern resulting from fluctuations in oceanic temperatures and atmospheric pressure differences across the Pacific Ocean. It operates in three distinct phases:
El Niño (Warm Phase of ENSO)
- SST Anomaly: Warm central & eastern Pacific.
- Trade Winds: Weakened or reversed.
- Effect on Indian Monsoon:Weaker monsoon, below-normal rainfall, higher probability of droughts.
Example: The 2009 El Niño led to a 22% monsoon deficit, causing severe drought in India.
La Niña (Cold Phase of ENSO)
- SST Anomaly: Cold central & eastern Pacific.
- Trade Winds: Stronger than usual easterly winds.
- Effect on Indian Monsoon:Stronger monsoon, excess rainfall, flood risks.
Example: The 2010 La Niña brought above-normal monsoon rains (106% of Long Period Average - LPA), leading to widespread floods in Pakistan and India.
ENSO Neutral (Normal Conditions)
- SST Anomaly: No significant deviation.
- Trade Winds:
- Effect on Indian Monsoon:Average monsoon rainfall.
Example: The 2017 monsoon season was ENSO-neutral, and India received near-normal rainfall (~98% of LPA).
ENSO Influence on Indian Monsoon
| Phase | SST Anomaly | Trade Winds | Effect on Indian Monsoon |
|---|---|---|---|
| El Niño | SST ↑ in the Pacific | Weakened or reversed | Weaker monsoon, droughts |
| La Niña | SST ↓ in the Pacific | Stronger easterly winds | Stronger monsoon, excess rainfall |
| Neutral ENSO | No anomaly | Normal trade winds | Normal monsoon conditions |
Walker Circulation & Its Role in Indian Monsoon
What is the Walker Circulation?
The Walker Circulation is a large-scale atmospheric circulation over the equatorial Pacific, driven by differences in sea surface temperature (SSTs) and atmospheric pressure. It consists of:
- Trade Winds: Easterly winds moving from South America (high pressure) to Indonesia (low pressure).
- Rising Air & Convection: Warm air rises over the western Pacific (Indonesia, Indian Ocean), forming clouds and rain.
- Sinking Air: Cooler, dry air sinks over the eastern Pacific (Peru, Ecuador), creating a stable high-pressure system.
Effect of El Niño on Walker Circulation
During El Niño, the Walker Circulation weakens or reverses, leading to:
- Weaker trade winds, allowing warm waters to move eastward.
- Reduced convection over the Indian Ocean, weakening the monsoon.
- Subsidence (sinking air) over India, leading to drier conditions and monsoon failure.
Example: The 2015 El Niño event led to a 14% monsoon deficit due to severe weakening of the Walker Circulation.
Southern Oscillation Index (SOI) & El Niño
Definition
The Southern Oscillation Index (SOI) is a measure of differences in sea-level atmospheric pressure between:
- Tahiti (Central Pacific, near 18°S, 150°W) – Represents eastern Pacific conditions.
- Darwin (Australia, near 12°S, 131°E) – Represents western Pacific conditions.
How SOI Works
- SOI > +8 → Strong Positive Index (La Niña)
- Higher pressure in the eastern Pacific.
- Lower pressure over the Indian Ocean → Stronger monsoon.
- SOI < -8 → Strong Negative Index (El Niño)
- Higher pressure over the Indian Ocean.
- Lower pressure over the eastern Pacific → Weaker monsoon.
SOI as a Predictor for Indian Monsoon
The SOI is used for early prediction of El Niño’s impact on the monsoon. A sharp drop in SOI (negative values below -8) from March-May often signals weaker monsoon rains.
Example: The 2002 El Niño event saw an SOI of -12, leading to a monsoon deficit of 21% and severe drought conditions.
Impact of El Niño on Indian Monsoon
Suppression of Monsoon Circulation
The Indian monsoon is primarily driven by low-pressure systems, monsoon winds, and moisture transport from the Indian Ocean. During El Niño years, these mechanisms weaken, leading to deficient monsoon rainfall over most of India.
Key Changes in Monsoon Circulation During El Niño
- Weakening of Low-Pressure System Over the Bay of Bengal
- Normally, a strong low-pressure system develops over the Bay of Bengal, drawing in moisture-laden winds from the Arabian Sea and the Indian Ocean, which fuel the monsoon rains.
- During El Niño, this low-pressure system weakens significantly, reducing the strength of the southwest monsoon winds.
- Impact: Reduced cloud formation, weaker rainfall, and more frequent dry spells.
- Northward Shift of the Monsoon Trough
- The monsoon trough is a low-pressure belt extending from the Rajasthan-Punjab region to the Bay of Bengal.
- In normal years, this trough oscillates north and south, ensuring widespread rainfall over India.
- During El Niño, the monsoon trough shifts northward, concentrating rainfall over the Himalayan foothills and northeast India while reducing rainfall over central, western, and peninsular India.
- Impact:Drought conditions in rainfed agricultural regions such as Maharashtra, Gujarat, Karnataka, and Andhra Pradesh.
- Increased Influence of Western Disturbances
- Western Disturbances (WDs) are extratropical cyclones originating in the Mediterranean region that influence winter rainfall in North India.
- During El Niño years, WD activity
increases, leading to:
- Erratic pre-monsoon and post-monsoon rainfall.
- Hailstorms in North India (damaging crops such as wheat).
- Delayed monsoon onset in some areas.
- Reduction in Monsoon Onset Strength & Early Withdrawal
- The onset of the monsoon (normally in early June) is delayed due to weaker low-pressure formation over the Arabian Sea.
- The monsoon withdrawal (normally mid-September) occurs earlier than usual, shortening the rainy season.
Example: In 2015, due to a strong El Niño, the monsoon onset was delayed by 10 days, and the withdrawal was 2 weeks earlier than normal, leading to a 14% monsoon deficit.
Historical Trends: El Niño & Indian Monsoon Rainfall
El Niño years are historically linked with weak monsoons in India.Below is data showing the correlation between El Niño years and Indian monsoon rainfall deficits
| Year | Monsoon Deficiency (%) | Major Drought? | Notes |
|---|---|---|---|
| 1982 | -18% | Yes | Severe drought in Central & South India. |
| 1987 | -19% | Yes | One of the worst droughts in India. |
| 1997 | -5% | No | Positive IOD offset El Niño impact. |
| 2002 | -21% | Yes | Widespread drought, major crop losses. |
| 2009 | -22% | Yes | Worst drought in 40 years, major food price inflation. |
| 2015 | -14% | Yes | Second consecutive drought year. |
| 2023 | -6% | No | Weak Positive IOD reduced impact. |
Key Observations:
- Strong El Niño events (1987, 2002, 2009) resulted in severe droughts, affecting agriculture and the economy.
- El Niño years with a strong positive IOD (1997, 2023) had moderate to near-normal monsoon rains.
- Consecutive El Niño years (2014-15, 2009-10) can have compounding effects, increasing the risk of long-term droughts.
Role of Other Climate Drivers
Apart from El Niño, other climate factors influence the Indian monsoon, sometimes amplifying or counteracting the effects of ENSO.
Indian Ocean Dipole (IOD) & Its Interaction with El Niño
What is the Indian Ocean Dipole (IOD)?
The Indian Ocean Dipole (IOD) is an ocean-atmosphere phenomenon occurring in the Indian Ocean, similar to ENSO in the Pacific. It involves:
- Positive IOD: Warmer western Indian Ocean (near Africa) and cooler eastern Indian Ocean (near Indonesia).
- Negative IOD: Cooler western Indian Ocean and warmer eastern Indian Ocean.
| IOD Phase | Temperature Anomaly | Impact on Indian Monsoon |
|---|---|---|
| Positive IOD | Warmer west Indian Ocean | Enhances monsoon, can offset El Niño impact |
| Negative IOD | Warmer east Indian Ocean | Weakens monsoon, amplifies El Niño impact |
Example: 1997 – Strong Positive IOD Offset El Niño
- 1997 had one of the strongest El Niño events, but monsoon rainfall remained close to normal.
- This was due to a strong positive IOD, which:
- Strengthened moisture transport to India.
- Enhanced low-pressure systems over the Indian Ocean.
Example: 2019 – Strong Positive IOD Led to Above-Normal Rainfall
- Despite weak El Niño conditions, 2019 received 110% of normal rainfall due to one of the strongest positive IODs in history.
How Does IOD Affect El Niño’s Impact?
- Positive IOD → Can reduce the negative effects of El Niño by maintaining moisture inflow.
- Negative IOD → Can worsen El Niño impact, leading to stronger droughts.
Madden-Julian Oscillation (MJO)
What is MJO?
The Madden-Julian Oscillation (MJO) is a large-scale eastward-moving tropical disturbance that influences rainfall patterns on a 30-60 day cycle.
MJO Phases and Their Effect on Indian Monsoon
The MJO moves across 8 different phases, impacting monsoon rainfall based on its location:
| MJO Phase | Location | Impact on Indian Monsoon |
|---|---|---|
| Phase 2-3 | Indian Ocean | Enhances monsoon |
| Phase 4-5 | Maritime Continent (Indonesia, Malaysia) | Neutral impact |
| Phase 6-7 | Western Pacific | Suppresses monsoon |
Example: 2018 Monsoon
- The monsoon started weak, but a strong MJO in Phase 3 (Indian Ocean) in August increased rainfall significantly, leading to floods in Kerala.
Example: 2023 Monsoon
- MJO was weak during June-July, contributing to below-normal rainfall in early monsoon months.
El Niño + MJO Interactions
- Strong MJO in Phases 2-3 (Indian Ocean) can temporarily enhance rainfall, even during El Niño years.
- MJO in Phases 6-7 (Pacific) during El Niño can worsen drought conditions.
Economic & Agricultural Impact of El Niño
Agricultural Consequences
Agriculture in India is highly dependent on the southwest monsoon, as nearly 55% of cultivated land is rainfed. El Niño years disrupt monsoon rainfall, leading to delayed sowing, reduced yields, and economic losses for farmers.
- Impact on Major Crop
Rainfed Crops (Worst Affected)
- Pulses (Tur, Moong, Urad, Lentils) – Require well-distributed monsoon rainfall. Deficient rains lead to lower productivity and higher imports.
- Oilseeds (Groundnut, Soybean, Mustard) – Rainfall deficit reduces flowering and pod formation, leading to low oil content and yield reduction.
- Millets (Jowar, Bajra, Ragi) – Traditionally drought-resistant but still require initial monsoon moisture for proper growth.
- Cotton – Erratic monsoons cause pest attacks (bollworms, pink bollworms), further reducing yield.
Kharif Crops (Monsoon-Dependent)
- Rice (Paddy) – Delayed monsoon onset leads to delayed transplantation, reducing grain filling and final yield.
- Maize (Corn) – Sensitive to moisture stress during flowering; drought conditions reduce cob formation.
Example: 2015 El Niño – India’s pulses and oilseeds output fell by 15%, leading to record high imports and inflation.
- Impact on Food Production & Inflation
- Reduced Food Output → Scarcity of essential commodities like pulses, oilseeds, and cereals.
- Supply Chain Disruptions → Higher transportation costs, storage losses, and price volatility.
- Food Inflation → Deficient monsoon reduces
supply,
driving up food prices.
- 2009 El Niño drought → Food inflation rose to 19% due to sharp declines in pulses and rice production.
- Increased Government Expenditure on Food Subsidies → More grain imports & higher MSP (Minimum Support Price) payouts.
Example: 2023 El Niño – Food inflation in India rose to 11%, with sharp price increases in pulses (20-30%) and vegetables (40%).
Hydropower & Water Scarcity
- Impact on Reservoirs & Water Availability
- El Niño years reduce monsoon rainfall, leading to low water storage in reservoirs.
- Major Indian reservoirs (Bhakra, Hirakud, Nagarjuna Sagar) face reduced inflows, affecting agriculture and drinking water supply.
- States Affected: Maharashtra, Karnataka, Gujarat, Madhya Pradesh, Tamil Nadu.
Example: 2002 El Niño – Reservoir storage in India fell to 48% of normal levels, leading to severe drinking water shortages in Western India.
- Impact on Hydropower Generation
- Hydropower contributes ~12% of India’s electricity.
- Reduced monsoon rains lead to low dam levels, affecting hydroelectric generation in Sikkim, Himachal Pradesh, Uttarakhand, and Kerala.
- Increased dependence on thermal power, leading to higher coal imports and rising power costs.
Example: 2015 El Niño – Hydropower generation fell by 20%, forcing states to rely on expensive coal-based electricity.
2023-24 El Niño Event & Its Impact on India
Recent Observations (2023-24)
- El Niño developed in June 2023, peaked in December 2023, and is declined by mid-2024.
- IMD (India Meteorological Department) reported a monsoon rainfall deficit of ~6%, lower than previous strong El Niño years.
- Why was the impact milder?
- A weak positive IOD (Indian Ocean Dipole) moderated some El Niño effects.
- Localized heavy rainfall events in August-September compensated for early-season deficits.
Key Impacts of 2023-24 El Niño
- Agricultural Losses:Kharif crop production dropped by 8%, especially in pulses and oilseeds.
- Food Inflation: Prices of dal (lentils), onions, and tomatoes surged by 30-40%.
- Water Crisis:Reservoir storage in Karnataka and Maharashtra dropped to 60% of normal levels.
Government Response
- Agricultural Relief Measures
- PM-KISAN Cash Transfers – ₹6,000 per year direct benefit to farmers.
- MSP Hike – Government raised MSP for pulses and oilseeds to encourage farmers to grow resilient crops.
- Food & Price Stabilization
- Increased food stock buffer – Higher procurement of wheat and rice to maintain buffer stocks.
- Ban on Exports of Certain Commodities – Restricted export of rice and onions to control domestic prices.
- Technological & Forecasting Improvements
- AI-based Monsoon Forecasting – ISRO satellites (INSAT-3DR, SCATSAT-1, Oceansat-3) monitor monsoon patterns in real-time.
- State-Level Water Conservation Programs – Maharashtra, Gujarat, and Karnataka launched groundwater recharge and rainwater harvesting programs.
Example: The Jal Shakti Abhiyan in 2023 focused on replenishing groundwater reserves to combat water shortages.
How El Niño Weakens the Indian Monsoon
Disruption of the Walker Circulation
- Normal Conditions:
- Trade winds blow from South America (high pressure) to Southeast Asia and India (low pressure), pushing warm waters westward.
- Rising warm air over the Indian Ocean strengthens the monsoon.
- El Niño Conditions:
- Trade winds weaken or reverse, pushing warm waters toward South America.
- Warmth shifts eastward, causing convection over the Pacific instead of the Indian Ocean.
- Weaker low-pressure system over India → Reduced monsoon rainfall.
Example: 2009 – One of the strongest El Niño years, leading to a 22% monsoon deficit and severe drought in India.
Weakening of the Monsoon Low-Pressure System
- The monsoon relies on a strong low-pressure system over the Bay of Bengal, which pulls in moisture-laden winds.
- During El Niño, this system weakens, leading to:
- Reduced moisture inflow from the Indian Ocean.
- Delayed monsoon onset and early withdrawal.
- Break monsoon periods (long dry spells between rainy days).
Example: 2015 – Due to El Niño, India received 14% below-normal rainfall, causing crop failures in Maharashtra, Karnataka, and Gujarat.
Shift in Monsoon Trough
- The monsoon trough (low-pressure zone extending from the Bay of Bengal to Rajasthan) is essential for rain-bearing winds.
- El Niño shifts this trough northward, leading
to:
- More rainfall in the Himalayan foothills.
- Less rainfall in central, western, and peninsular India.
Example: 1987 – El Niño caused a monsoon deficit of 19%, severely affecting Punjab, Haryana, and western India.
El Niño’s Impact on Agriculture and Water Resources
Crop Failures and Food Inflation
- Rainfed crops (pulses, oilseeds, cotton, coarse grains) are worst affected.
- Rice and wheat production drops, leading to higher food inflation.
- Farm distress increases, with reduced rural employment under schemes like MGNREGA.
Example: 2002 Drought – 21% monsoon deficit led to 15% lower food grain output, forcing India to import wheat.
Water Shortages and Hydropower Decline
- Reservoir storage drops, reducing drinking water availability.
- Hydropower generation falls due to low dam water levels.
- Drought-prone states (Maharashtra, Karnataka, Gujarat, Tamil Nadu) suffer the most.
Example: 2015 El Niño – Hydropower production dropped by 20%, causing power cuts in South India.
Government Measures to Mitigate El Niño’s Impact
Agricultural Adaptation
- Promote drought-resistant crops (millets, pulses, sorghum) – National Food Security Mission
- Expand irrigation schemes (PMKSY, micro-irrigation) – Drip & sprinkler irrigation to conserve water
- Encourage crop insurance (PMFBY) – Compensation for farmers facing crop losses
Water Management and Policy Interventions
- Jal Shakti Abhiyan – Groundwater recharge & rainwater harvesting
- AI-based monsoon forecasting (IMD + ISRO satellites) – Real-time weather monitoring
- Buffer food stock policy – Government stockpiling to control inflation during droughts
Example: 2023 Response – India restricted rice exports and increased food subsidies to control food inflation due to weak monsoon rains.
Technological & Policy Interventions
- Early Warning Systems → Strengthen AI-based monsoon forecasting (IMD & ISRO collaboration)
- Water Conservation Measures → Jal Shakti Abhiyan to promote rainwater harvesting and reservoir management
- Strengthening National Disaster Response → NDRF teams for drought relief, contingency planning for food security